
We mapped review concentration across all 120 Shopify App Store categories. In the median one, 3 apps hold half the reviews — but the biggest categories are mostly empty, and a few are wide open. Here's where there's still room to build.
Which Shopify App Categories Are Winner-Take-All? We Mapped All 120
The Shopify App Store has thousands of apps, and it is tempting to read that as thousands of real choices. It isn't. Across the 30 biggest categories, the median one has just three apps holding half of all the reviews — and a single app holding a fifth.
We mapped every app to its categories and measured how concentrated the reviews are in each. What comes out is not one big competitive market. It is 120 small ones, each with its own balance of power, and they could not be more different from one another.
In the median category, 3 apps own half the reviews
Reviews are the clearest public signal of how many stores actually run an app. Add them up per category and, in most, they pile onto a handful of names.
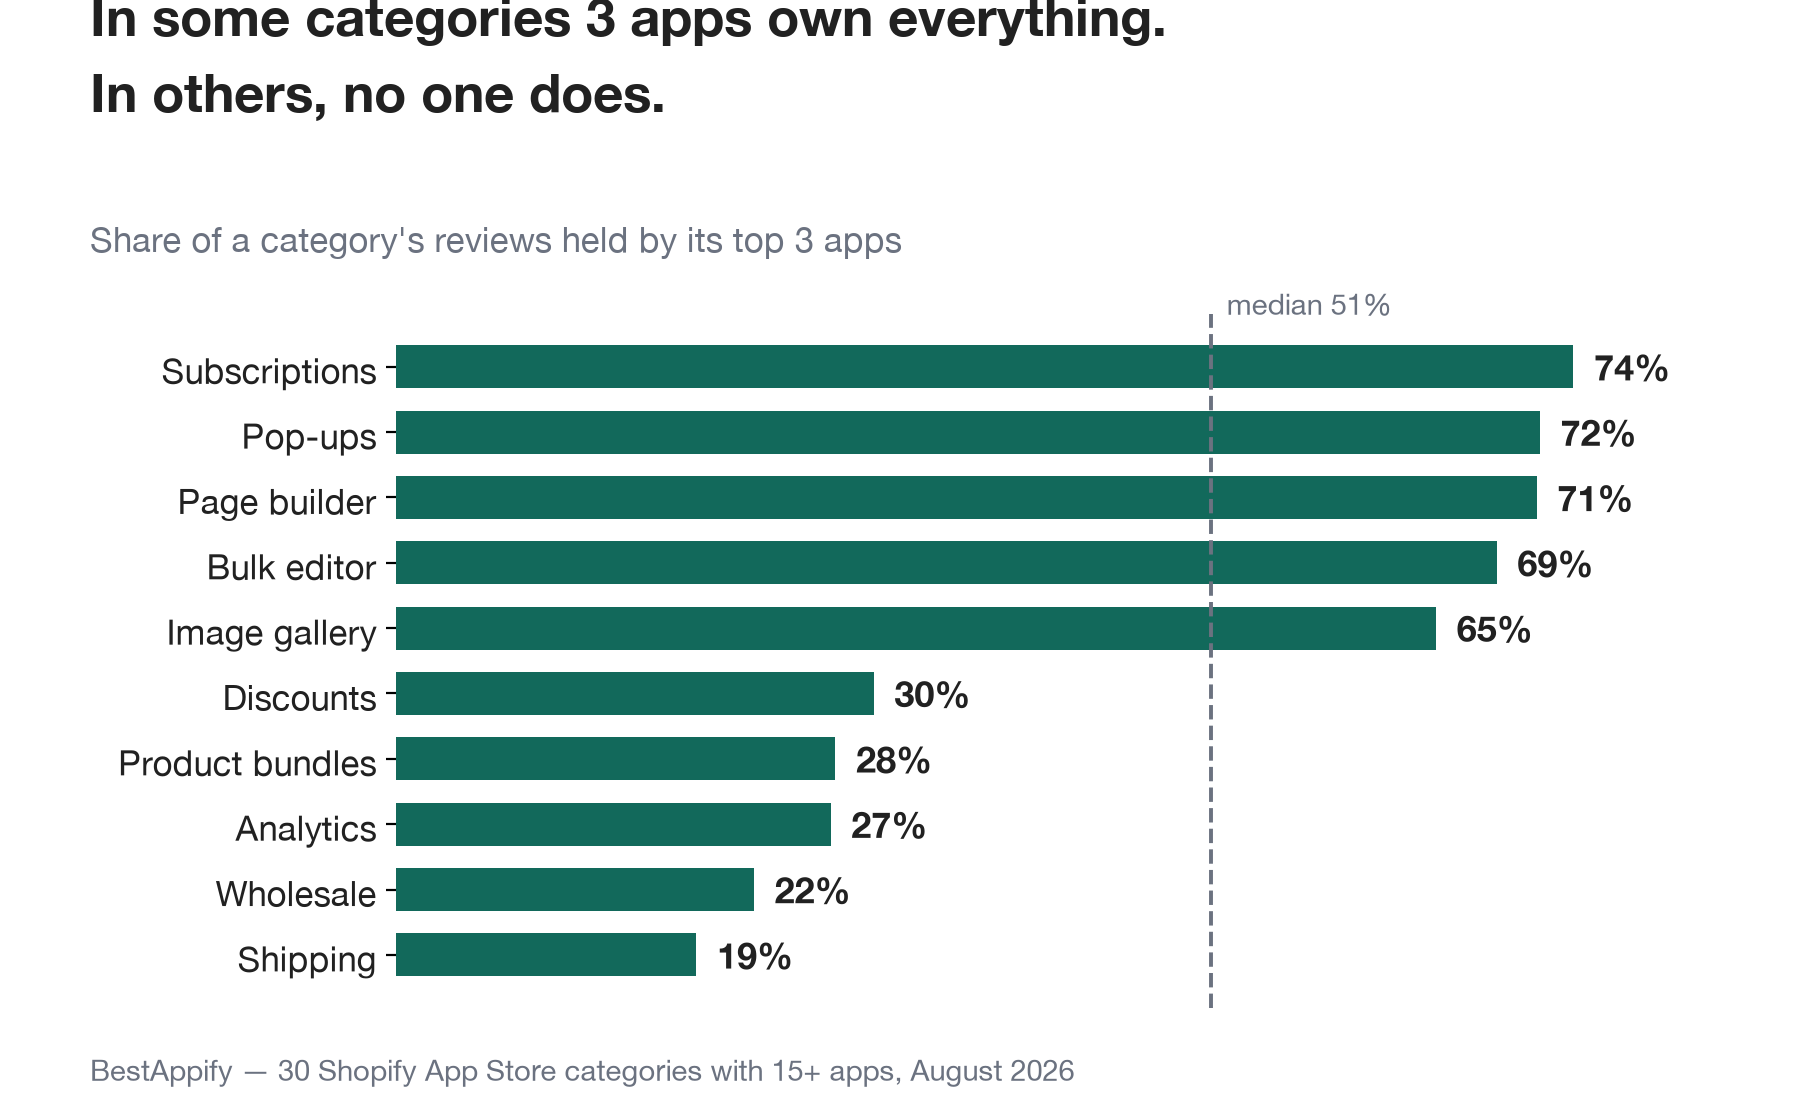
At one extreme sit the locked categories. In Subscriptions the top three apps hold 74% of the reviews; in Pop-ups, 72%; in Page builder, 71%. These are markets with an entrenched incumbent, where a newcomer is fighting for scraps of attention.
At the other end, the leaders barely register. Shipping's top three hold just 19% of its reviews, Wholesale's 22%, Analytics' 27%. Reviews are spread thin across many apps — which means a strong new entrant can still take a real slice.
The biggest categories are the emptiest
Here is the trap: the most crowded categories are not the most competitive. They are the most abandoned.
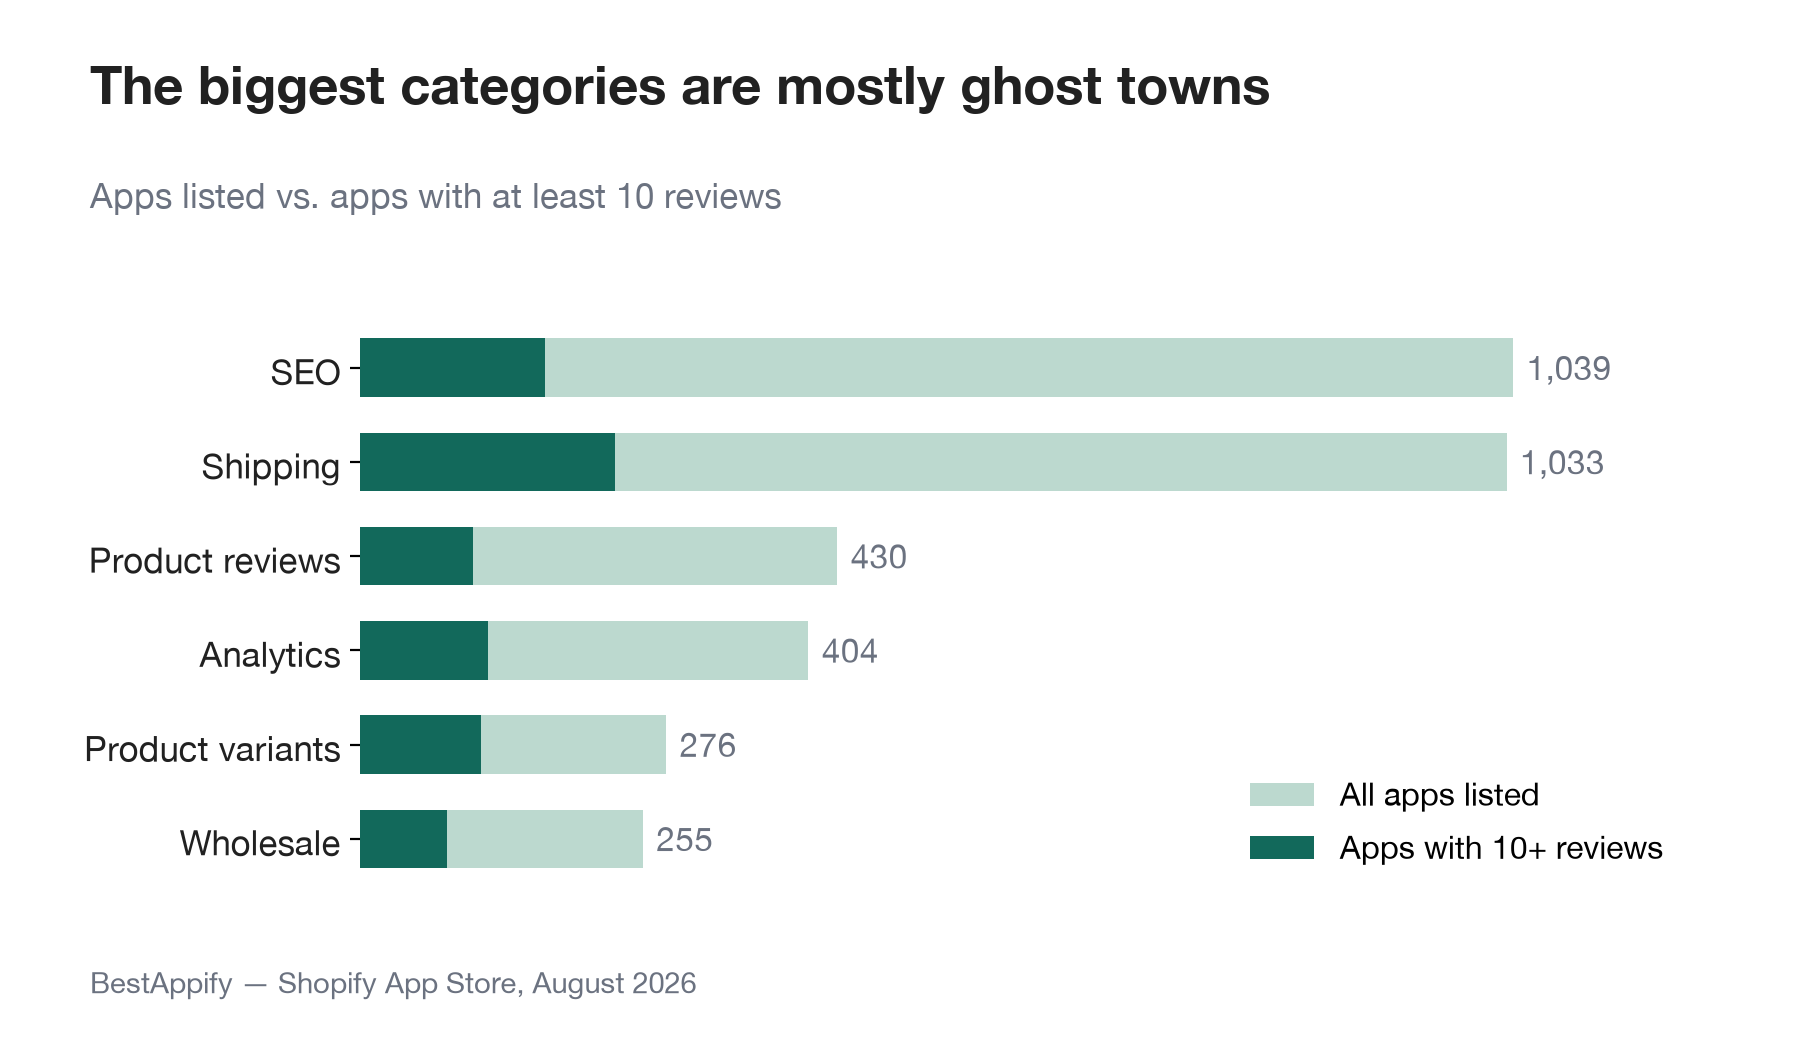
SEO lists 1,039 apps — but only 167 of them have even ten reviews. Shipping lists 1,033; just 230 are that active. Roughly five out of every six apps in the biggest categories have almost no traction at all. A “1,000-app category” is a headline number hiding a graveyard: a few giants collecting the reviews, and a very long tail collecting none.
The starkest example is Product reviews. 430 apps compete in it, yet Judge.me alone holds 49% of every review in the category. One app, nearly half the market.
Crowded, locked, or open?
Put the two measures together and every category settles into one of three shapes:
- Locked — few apps, one clear winner (Subscriptions, Page builder, Bulk editor, Image gallery). Hard to break into; a safe default if you're a merchant.
- Crowded graveyard — thousands of apps, most dead, a handful of giants (SEO, Product reviews). It looks impossible, but most of the “competition” isn't real.
- Open — many active apps, no dominant name (Shipping, Wholesale, Analytics, Product bundles, Discounts, Upsell). This is where a new app has the clearest shot.
What this means for you
- If you're building an app: choose your category by concentration, not size. A giant category can be both crowded and locked; a mid-sized one can be wide open. Aim where reviews are spread and no single app owns the attention — that's where momentum is winnable, and as we saw when we tracked the leaderboard, momentum moves fast.
- If you're a merchant: in a locked category, the top one or two apps are usually the safe default — they earned that lead. In an open one, it pays to shop around; the “best” app is far less settled, and a smaller name may fit your store better than the biggest.
Browse the catalogue by category to see the balance of power in the ones you care about, or run a free store audit to see how the apps you already run stack up against their category.
Methodology: we mapped all 7,636 live Shopify apps to their listed categories (5,024 app–category memberships across 120 categories) and summed each app's review count within each category. “Top 3 share” is the share of a category's total reviews held by its three most-reviewed apps; medians are taken across the 30 categories with at least 15 apps. Apps can be listed in more than one category, so a few cross-listed giants influence the categories they appear in. Crawled August 2026.