
Every developer says August is dead. Across 501 apps with complete review history, activity ran 8% below late July — a real dip, and far too small to explain the drops developers actually report.
Is August Really the Shopify App Store's Dead Month? We Measured It
Ask a Shopify app developer how August is going and you will hear a version of the same thing: it is dead. Installs are down, the store feels quiet, and the explanation is that merchants are on holiday. It is a comfortable story, because it means the dip is not your fault.
We crawl the Shopify App Store every day, so we can check it. The short answer: August is down — by about 8%. Which is a real dip, and nowhere near the collapse the folklore describes.
What we measured, and why it is harder than it looks
Nobody outside Shopify can see installs, so we use the closest honest proxy: reviews left per day. A review is a merchant who installed an app, used it, and came back. It lags installs and it is noisy, but it is real, and it is measurable at scale.
The trap is that you cannot simply count review rows by date. A crawler covers different apps at different times, so a naive daily count measures when the crawler ran, not when merchants reviewed — we got this wrong ourselves before catching it. Two corrections make the comparison honest, and both matter:
- One fixed cohort. Only apps whose review history is complete through the end of the study, compared against themselves in every window — 501 apps.
- Only apps seeded before the first window. Include an app whose history starts in July and June is silently undercounted, which invents an upward trend out of nothing.
The result: a dip, not a cliff
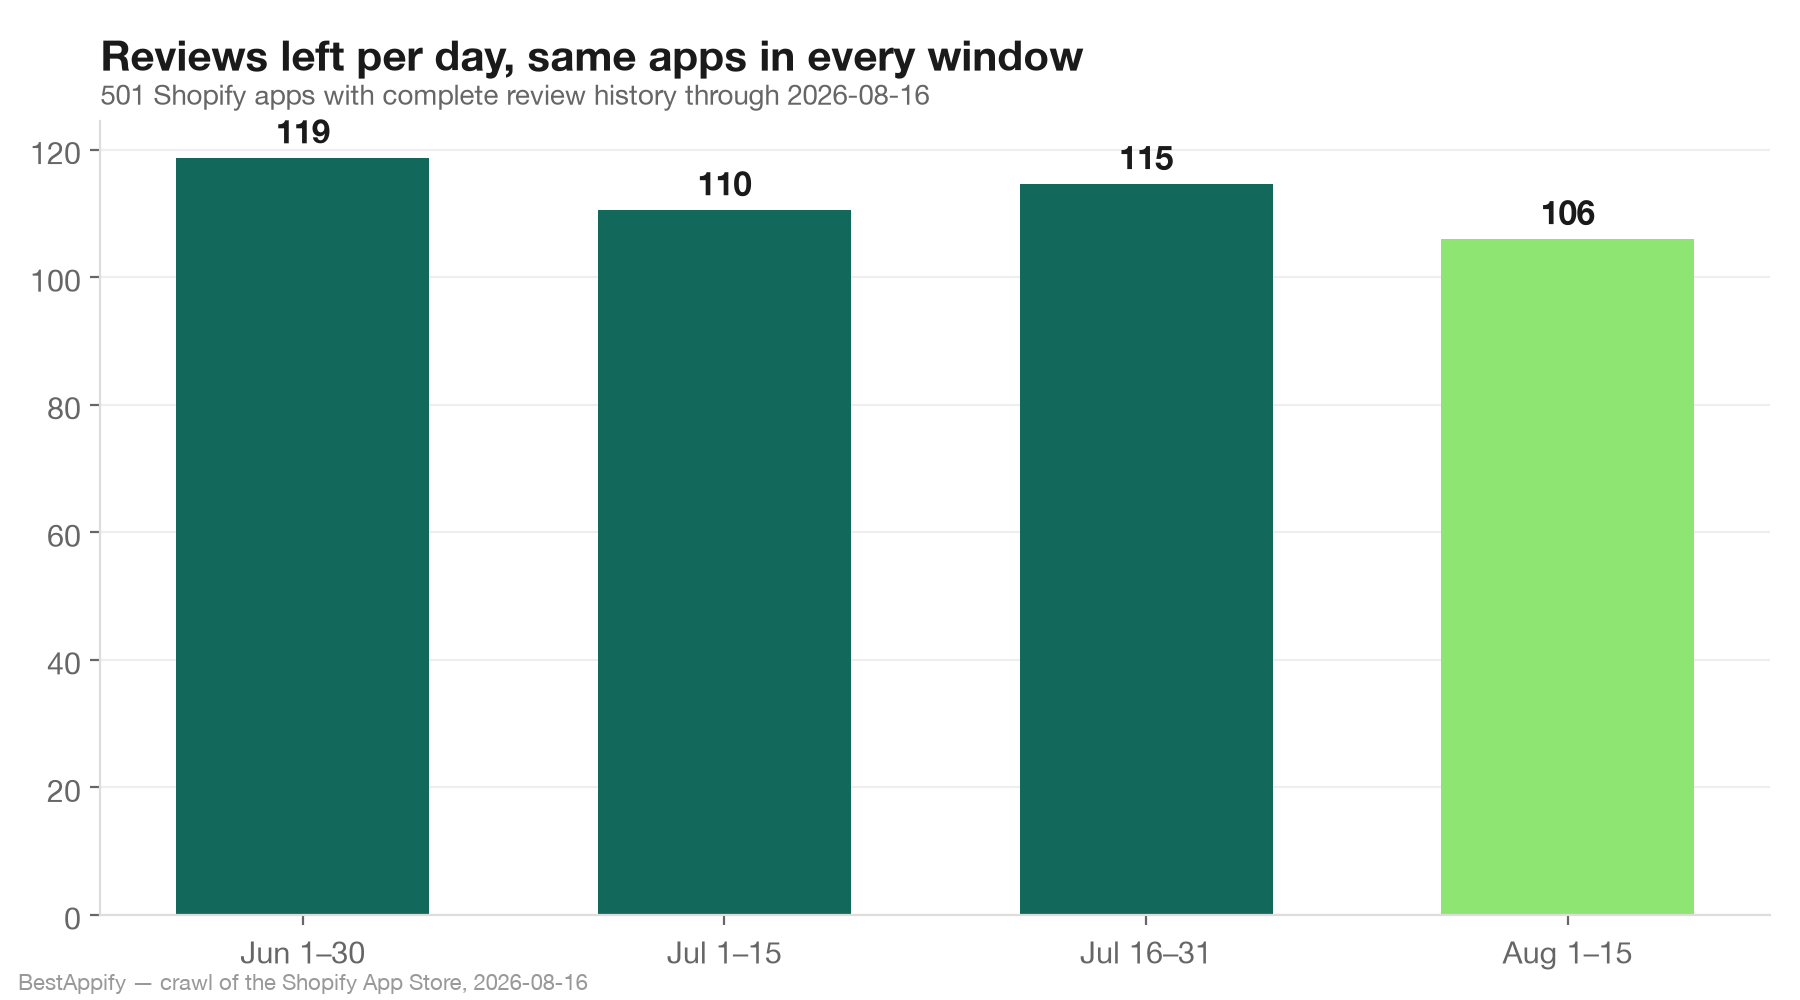
Reviews per day ran at 119/day in Jun 1–30, 110/day in Jul 1–15, 115/day in Jul 16–31 — and 106/day in Aug 1–15. August sits 8% below the second half of July and 11% below June.
So the instinct is not imaginary. Merchant activity in the first half of August really is softer than the weeks before it. But 8% is the size of a slow fortnight, not a shutdown — and it is nothing like the drops developers describe when they say August killed their installs.
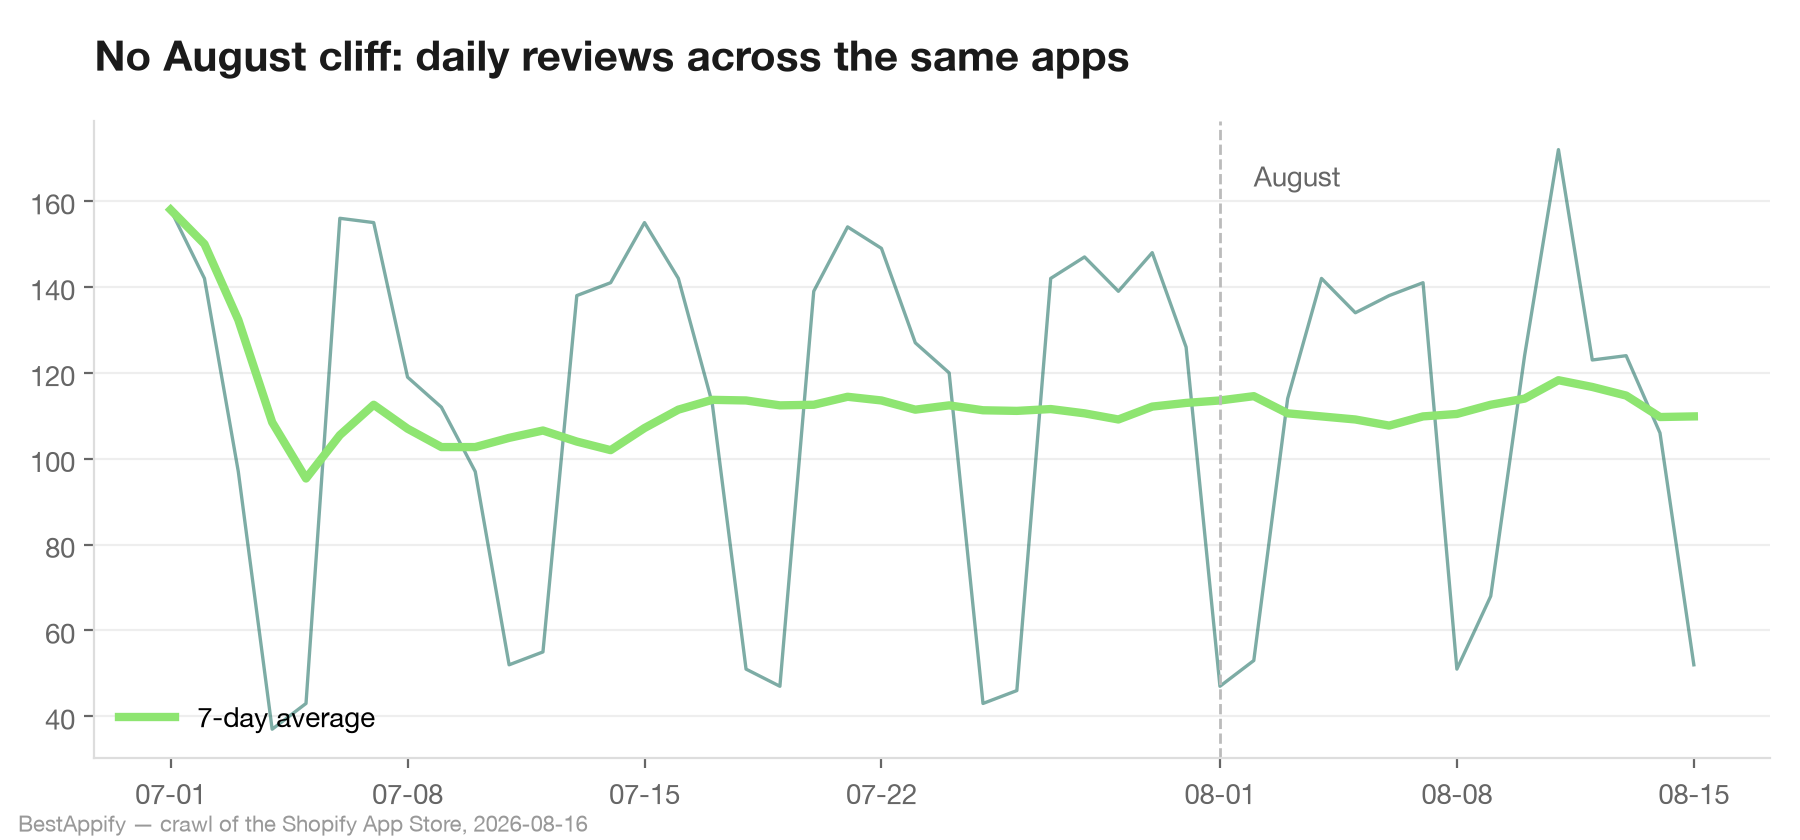
So why does your August feel so much worse than 8%?
Because at the scale most apps run at, distribution moves far more than demand does. A mid-sized app might see a handful of organic installs a day. Slipping two positions on one search term you rank for can halve that — and a competitor rewriting their listing, a new entrant, or a routine rankings reshuffle all produce exactly the pattern people file under seasonality: a quiet week that arrives with no explanation.
Put the two side by side. The market moved about 8%. If your installs are down 40% or 50%, seasonality accounts for a small slice of that and something about your position accounts for the rest. That distinction decides what you do next, because the two stories point opposite ways: if the market is asleep, waiting is correct. If your position changed, waiting is the one response that cannot help.
What to check instead of the calendar
- Your rankings over the same period. A rank slip and a seasonal lull look identical in an install chart and nothing alike in a rank chart.
- Competitor listings. A new title, a new pricing tier, or a burst of reviews on the app above you moves your traffic without you touching anything.
- Which searches you are competing on. Difficulty varies enormously across App Store terms: on some, the whole top 10 holds a few hundred reviews between them; on others, tens of thousands. Where you compete decides more than how polished your listing is.
Method and limits
Data is our own daily crawl of the Shopify App Store, current to 2026-08-16; the final day is excluded because the crawl ran during it. The cohort is 501 apps whose review history is both complete through that date and reaches back before June, compared per-day so unequal window lengths do not distort anything. Three honest limits: reviews lag installs by days or weeks, so this tracks merchant activity rather than install timing; the cohort is established apps with reviews to leave, so it says nothing about how a brand-new listing fares in August; and this is one August — a single year is a data point, not a season.
Want to know whether your own dip is the market or your position? BestAppify tracks App Store rankings, competitor listings and review trends daily — the free plan covers one app.