
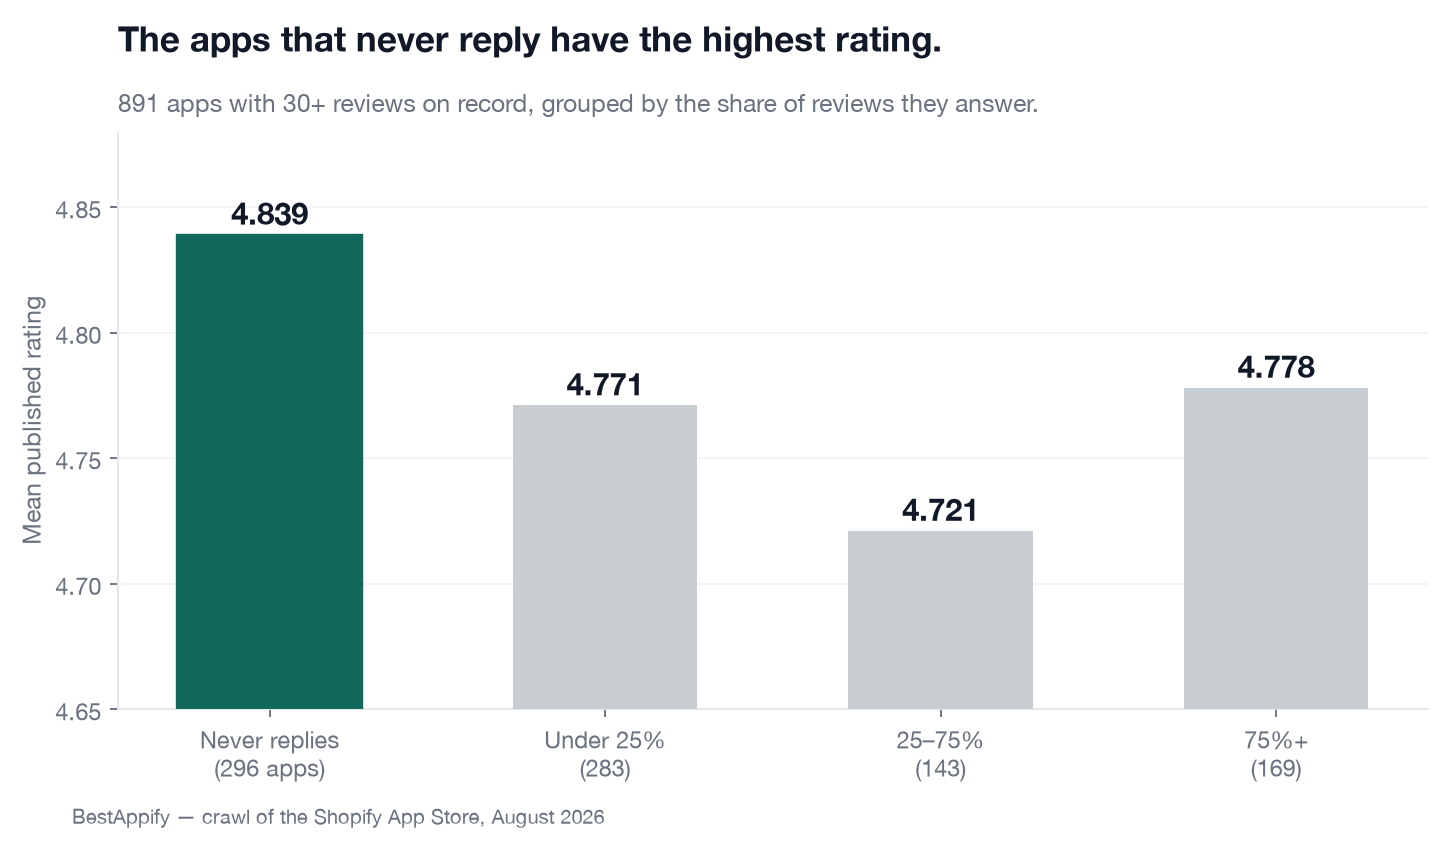
The 296 apps that have never replied to a review average 4.839 — the highest of any group. Hold complaint load fixed and the effect vanishes entirely. What does correlate: answering your 1-2 star reviews specifically, which the best-rated apps do far more of while replying less overall.
Replying to Reviews Does Not Raise Your Shopify App Rating. We Checked 891 Apps
Every guide to running a Shopify app tells you to reply to your reviews. Reply to all of them, reply fast, and your rating will follow. It is one of the few pieces of App Store advice that nobody argues with.
We hold reviews for the whole catalogue, so we can check it instead of repeating it. Across 891 apps, it does not hold. The apps that reply to nothing have the highest average rating in the store.
What we measured
Every app in our catalogue with at least 30 reviews on record — 891 of them. For each we computed the share of reviews carrying a developer reply, and compared it to the app's published App Store rating, not to the average of the reviews we happen to hold. That distinction matters and we got it wrong the first time; more on that at the end.
The correlation between reply rate and rating is −0.08. That is not a weak positive relationship. It is nothing, pointing very slightly the wrong way.
The causation runs backwards
Read as advice this is nonsense — surely answering an unhappy merchant cannot make things worse. Read as data it is obvious the moment you cut it the other way.
Apps with a bad rating reply more, because they have more to answer. Apps rated under 4.3 answer 39.8% of their reviews. Apps rated 4.9 and above answer 25.0%. The reply rate is not causing the rating; the rating is causing the reply rate.
So the real test is whether replying helps once you hold the complaint load fixed. We split the 891 apps into quartiles by what share of their reviews are 1–2 stars, and compared heavy repliers to light repliers inside each quartile.
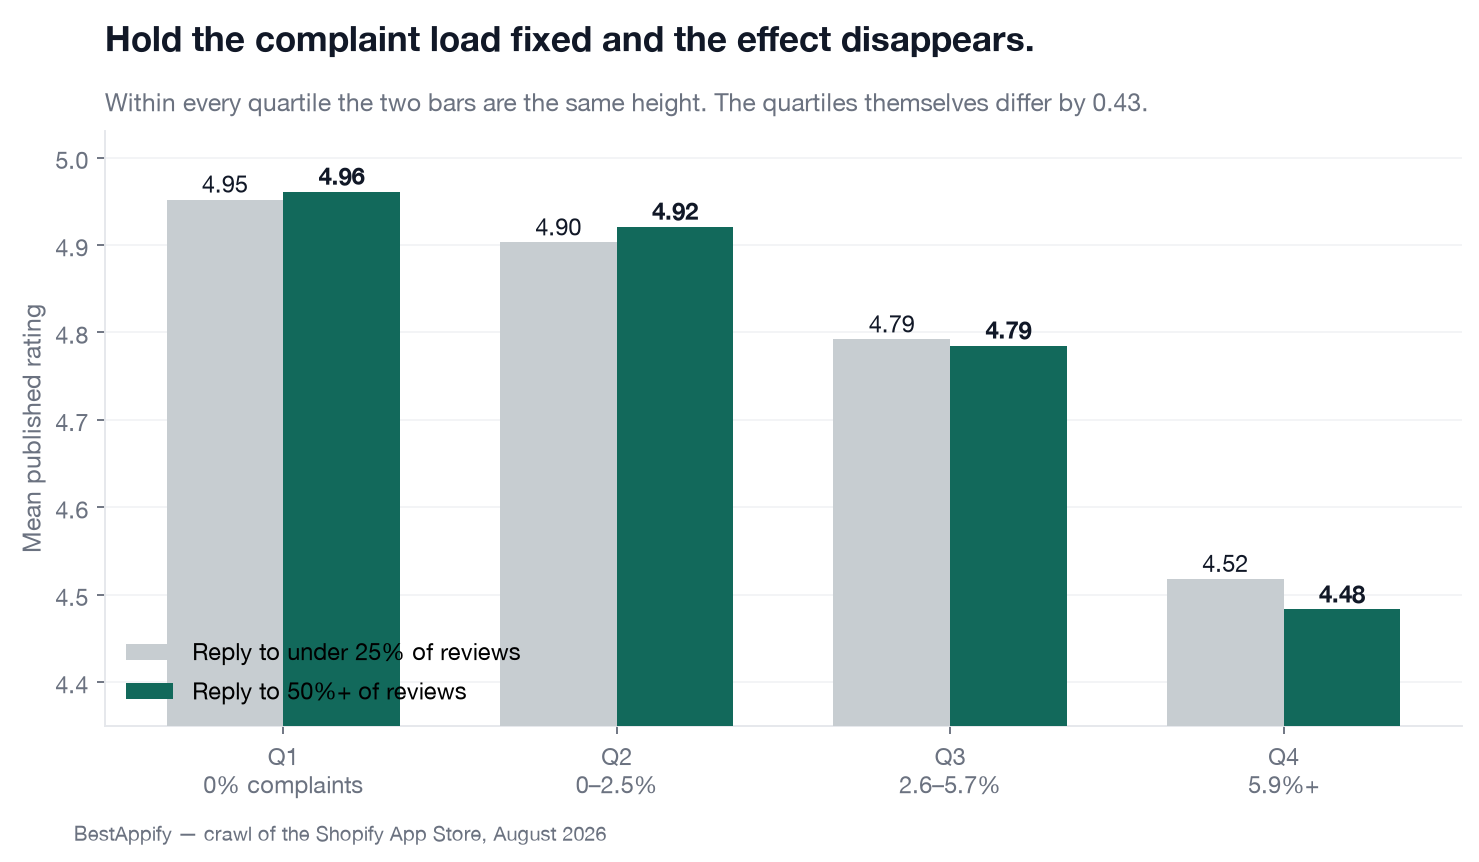
Within every quartile the difference is somewhere between 0.01 and 0.035 rating points, and in the two quartiles with the most complaints the heavy repliers score slightly lower. There is no effect here to find. What separates a 4.95 app from a 4.48 app is roughly twenty times larger than anything reply behaviour explains, and it is simply how many people complained.
The one thing that does point somewhere
There is a second pattern in the data, and it inverts the advice rather than deleting it.
Best-rated apps answer fewer reviews overall — but a much higher share of their critical ones.
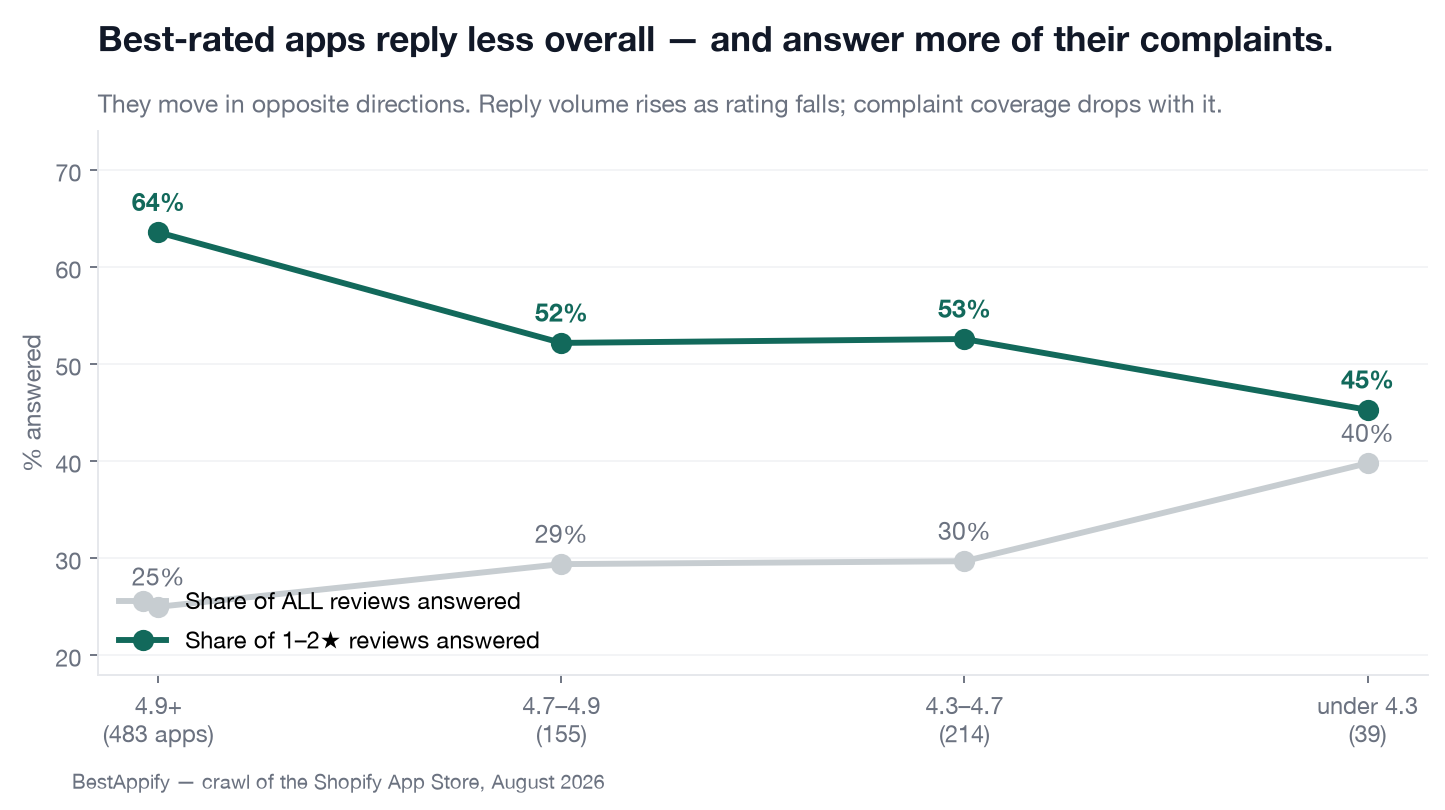
The two lines move in opposite directions. An app rated 4.9+ answers 25% of its reviews and 64% of its 1–2 star ones. An app under 4.3 answers 40% of its reviews and 45% of its complaints. The struggling apps are replying more and covering less, which is what drowning looks like.
Controlling for complaint load again, critical reply rate has a consistently positive sign in every quartile — +0.134, +0.067, +0.094 — where overall reply rate flips between positive and negative. It is still small (0.02 to 0.05 rating points) and we would not call it an effect. But it is the only reply behaviour in this dataset that points the same way twice.
What this means in practice
If you are answering reviews to protect your rating, the data does not support the time you are spending. Answer them because a merchant asked you a question, because the reply is public and the next reader sees it, or because you want the support signal. Those are good reasons. "It will lift my score" is not one we can find evidence for.
And if you are going to ration the effort: ration it toward the 1–2 star reviews. That is the only cut where the sign is stable, it is the cut the best-rated apps are already making, and an unanswered complaint is the one a prospective installer actually reads.
The uncomfortable version of this finding is that your rating is mostly decided before the reply box opens. It is set by how many people had a bad time. That is a product and support problem, not a review-management one.
What we can't tell you
- We hold a sample of each app's reviews, not all of them. The median app here has 66 reviews on record against 285 published — about 24% coverage. Reply rate is measured on that sample. If an app's reply habits changed sharply over time, we would be measuring the wrong era of it.
- This is correlational and we cannot run the experiment. The clean test would be the same app replying and not replying over the same period, which does not exist. Stratifying by complaint load is the best available substitute, not a substitute for randomisation.
- Rating is not the only thing a reply could move. We cannot see installs, churn, or whether a merchant edited a bad review upward after being helped. A reply that turns a 1-star into a 4-star would show up in our data as a lower complaint share, and we would credit it to the complaint count rather than to the reply.
- The complaint-share correlation is close to arithmetic. More 1–2 star reviews mechanically means a lower mean. We report it as the dominant factor, not as an insight.
Method: 891 apps with 30 or more reviews on record. Reply rate is the share of stored reviews carrying a developer reply; critical reply rate is the same over 1–2 star reviews only. The outcome is the app's published App Store rating. Quartiles are cut on the share of an app's stored reviews that are 1–2 stars. An earlier internal version of this analysis compared reply rate to the mean of our stored reviews rather than to the published rating — the finding held either way (−0.088 vs −0.082), but the published rating is the honest outcome variable and is what is reported here.